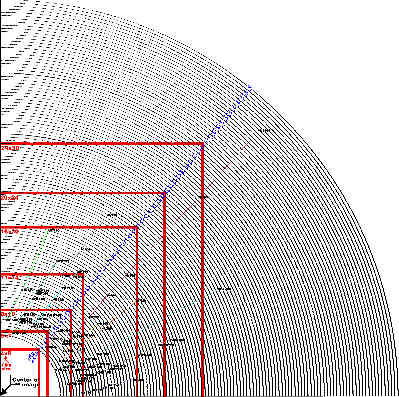
KEY TO THE GRAPH:
-
SERIES:
-
The Rectar lenses are not displayed. They are probably exactly the
same as the Fujinar lenses -- which are displayed.
-
The Fujinar series is designated "R". The image circles for these lenses
are guesstimates.
-
The SWD (Super Wide Deluxe) series is designated "SWD".
-
The SW (Super Wide) series is designated "SW".
-
The NSW (New Super Wide) series is designated "NSW".
-
The W (Wide) series is designated "W".
-
The NW (New Wide) series is designated "NW".
-
The L (Long ) series is designated "L". The T-Navitar lens is included and
appears as "LNAV".
-
The T (Telephoto) series is designated "T".
-
The SF (Soft Focus) series is designated "SF".
-
The C (Compact) series is designated "C".
-
The A (Apochromatic) series is designated "A".
-
The Fujinon series of lenses are designated "F".
-
The CM-W series is designated "CMW".
The lenses in each series are connected with a specific, colored, dashed
line on the graph.
Some of the lenses had small variations in the image circle as they evolved
over time. As a result, the figures on this graph may not be exact
for any particular lens.
This is a rather large GIF file and it may take a bit of time to load, depending
on your computer, your download speed, etc. Depending on your situation,
browser, etc., it might be best to import the GIF file into a separate graphics
program for more flexible viewing.
Click HERE to view the graph.